Checking experimental data for consistency
Trends over time:
To verify that the sample “behaves” stationary during the measurement, it is helpful to plot a few selected features versus time. No systematic deviations should be observable, as in the figure below.
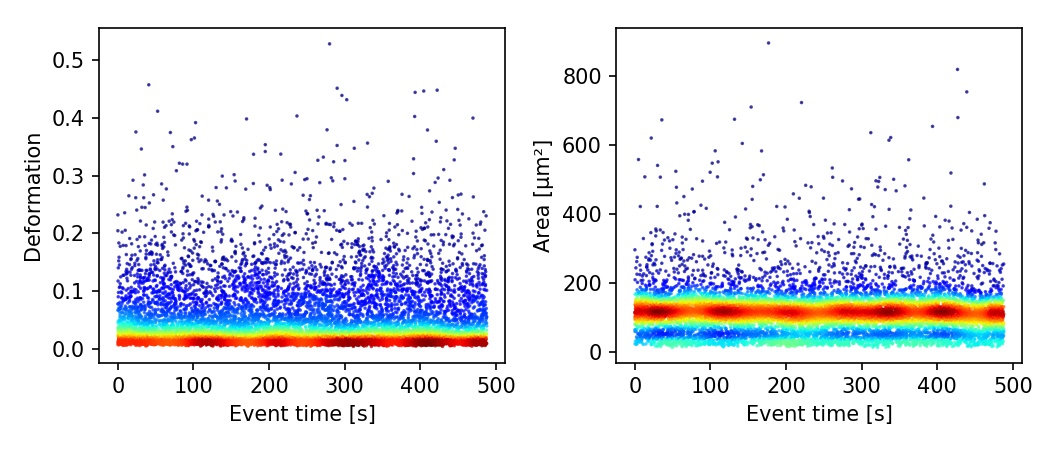
Fig. 15 Deformation and event area versus time. There is no systematic trend over time, indicating stable measurement conditions.
Countrate:
Trends over time do not directly visualize the count rate (measured events per second). The count rate is the slope of the event index versus event time plot and should remain constant.
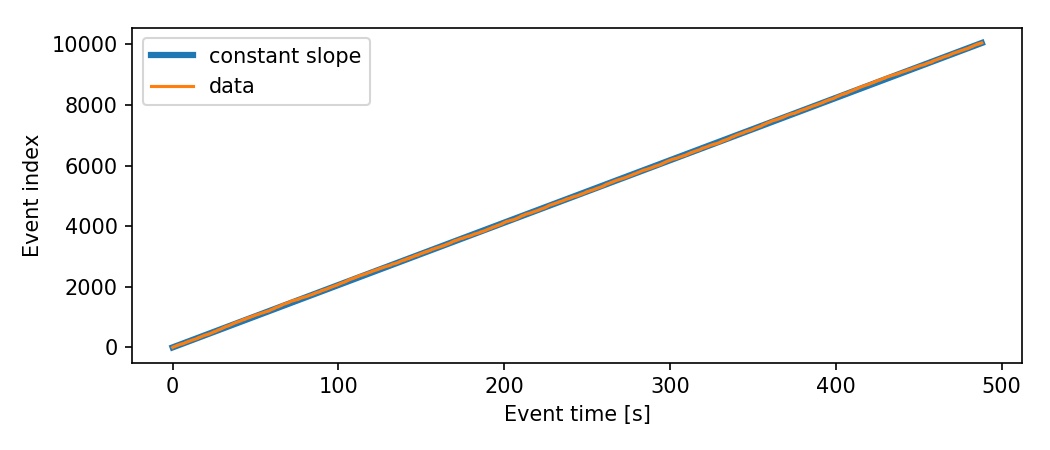
Fig. 16 The event index versus event time plot shows a constant slope, an indicator for stable measurement conditions.